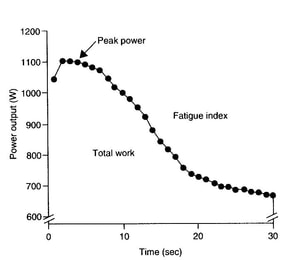
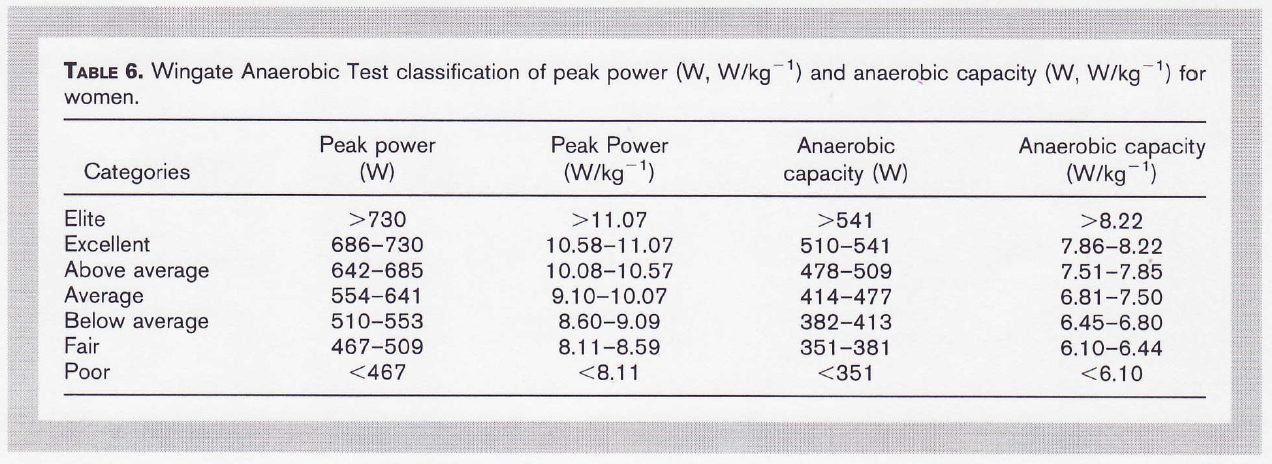
 In our last two blog posts we have talked extensively about lactate threshold, what it is and how to develop it. Your lactate threshold is mainly a predictor of your aerobic capabilities, so this week we have decided to focus on your bodies anaerobic capabilities. Team sports, athletic events and some CrossFit workouts require athletes to be able to utilise anaerobic energy pathways. To recap, your anaerobic energy pathways are your ATP-PC system and anaerobic glycolytic energy pathway, both of which allow working muscle to produce large amounts of ATP quickly and without the need for oxygen. The downside of these systems, is that they can only produce ATP at this rate for between 10 and 90s. In athletic events such as the 100-200m sprint, power events such as the shotput or Olympic weightlifting, team sports where short sprints are required, and short CrossFit metcons or team workouts, anaerobic energy pathways will be the bodies primary source of energy. Anaerobic performance, is determined by a combination of anaerobic power and anaerobic capacity. Anaerobic power represents the bodies highest rate of anaerobic energy production, and typically occurs within the first 5s of maximal anaerobic performance. Anaerobic capacity reflects the maximal anaerobic energy production an individual can obtain before exhaustion. Generally if two players or athletes have the same level of skill/technique, the athlete who has the greatest anaerobic power and capacity will outperform the other. Before we look into the different training methodologies to develop anaerobic performance, we must first be able to assess an athlete’s capabilities, to set a benchmark to measure improvement, and to identify how that athlete compares with athletes of a similar current ability, or against athletes competing at the level the athlete wants to reach. The Wingate Anaerobic Test (WAnT) is the most common way of measuring an athlete’s anaerobic performance, allowing anaerobic power, anaerobic capacity and rate of fatigue to be measured. The test is performed on a cycle ergometer, and involves a single 30s bout of all-out effort, against a resistance equivalent to 7.5% of the athlete’s bodyweight. As seen in the graph below, the test allows the creation of a graph, showing an athletes peak power, total work and rate of fatigue. Rate of fatigue is calculated by looking at the difference between the highest power output maintained for 5s of the test, and the lowest power output maintained for 5s of the test. Rate of fatigue is an important output of the Wingate test, as in longer anaerobic events such as the 200 or 400m sprint, it is often the athlete who fatigues the least who comes out on top. But what causes this rate of fatigue? A by-product of anaerobic energy production is lactic acid. This lowers the PH of muscle cells from 7.1 to 6.5-6.8, which has an inhibitory effect on various functions in the muscle cell, leading to a decrease in force production. The mechanisms of fatigue, and how we might train to delay the onset of fatigue, is something we will look at in our next post. The tables below show targeted anaerobic performance levels for different levels of both male and female athletes. Of course, being able to conduct the test yourself to draw comparisons to this data require you to have access to cycle ergometers capable of producing this kind of data. In our next post we will also take a look at how you could adapt this test using the equipment you would expect to find in a gym, to allow you to benchmark your athletes.
3 Comments
|
AuthorSam Henderson Archives
May 2019
Categories |


 RSS Feed